Observations
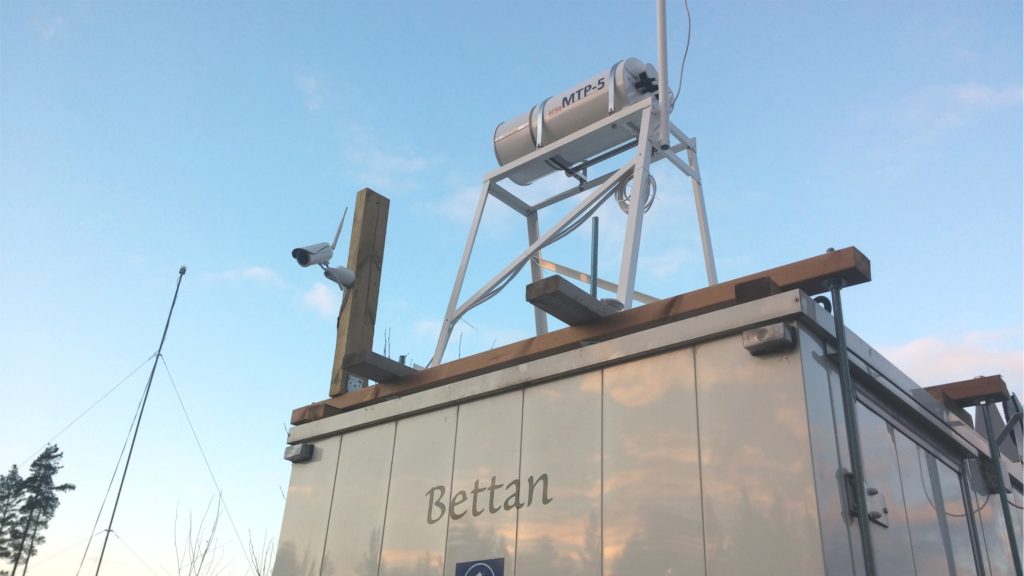
A microwave radiometer has been installed at a WindCoE-project site for measuring the atmosphere to help understand why distantly propagated sound has so much variability. Especially wind turbine sound. The radiometer scans the atmosphere and measures temperatures up to 1000 meters at time intervals of five minutes. We intend to average these data to coincide with the temporal resolution of other data taken at the site.
Other equipment at the site taking data at 10 minute intervals include a sodar measuring wind speed and wind direction at heights from 50-200 m. Meteorology stations on the top of wind turbine nacelles are measuring at a height of 120 m. A mast mounted met station is measuring basic meteorological parameters also at a height of 10 m. Acoustic data measured at ground level is also being recorded at an interval of 25,600 times per second (we have a way to summarize it into 10-minute intervals).
Some of these observations are being used for estimating effective speed of sound fields in the atmosphere. The speed of sound is also called celerity and it primarily depends upon temperature plus wind profiles through the atmosphere. We will use this information to determine if we can qualify the Weather Research and Forecasting model (WRF) to be helpful in estimating the details of the atmosphere as we work to understand sound traveling in the environment.
The Finnish weather and temperature inversions
Finland’s climate has characteristics of both a maritime and a continental climate, depending on the direction that frontal passes. The mean temperature in Finland is several degrees higher than many other areas at the same latitudes because of the influence of the heat distribution from the oceans. Weather can also change quite rapidly, particularly in winter. (1)
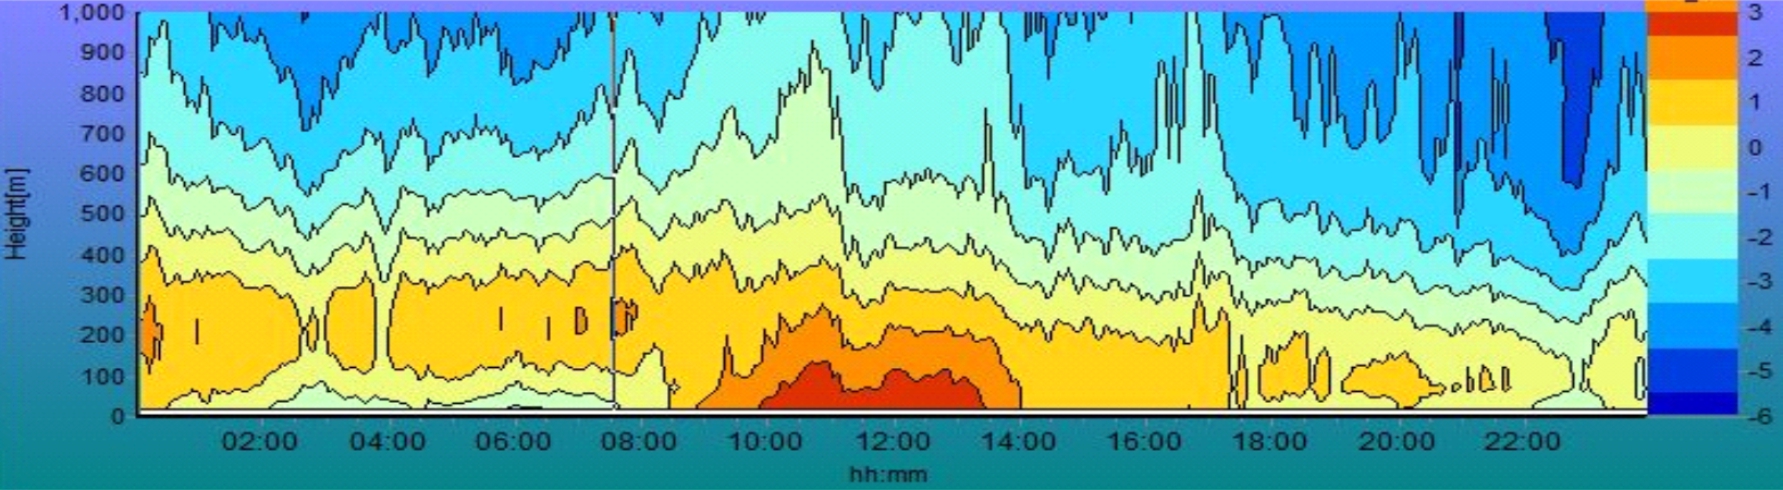
With the radiometer, we have already observed surface based temperature inversions with a strength of 8 degrees spanning the 0 to 200m altitude range. This means the temperature increased 8 degrees from 0 to 200m and this condition is not so common except in cold climate areas. This is called a surface based inversion and it is indicative of an extremely stable atmosphere.
When high pressure is dominant across Finland in winter, the atmosphere is characterized by a near permanent temperature inversion, meaning warmer air can be found over a cooler air. The low sun angle and the short days in winter do not allow enough heat to erode the inversions in the high latitudes. The ordinarily occurring stratus clouds (low level clouds) also play an important role in vertical transfer of heat and moisture. Numerical models quite often experience difficulties in forecasting inversions and low clouds during winter. (1) The image below shows differences in atmosphere temperature at different heights during a 24 h period from the radiometer.
Temperature inversions and their effect on sound propagation
The Nordic weather, with high proportions of ground based temperature inversions can have effects on environmental noise propagation. Inversion means that layers of air have temperature increasing in as elevation increases. In cold climate areas, layers of colder air usually form near the earth´s surface during winter time. The inversion layer can de-couple the surface winds from the stronger upper layer winds. For this reason, surface wind speeds tend to be lower than upper wind speeds in winter than one might expect. (1) 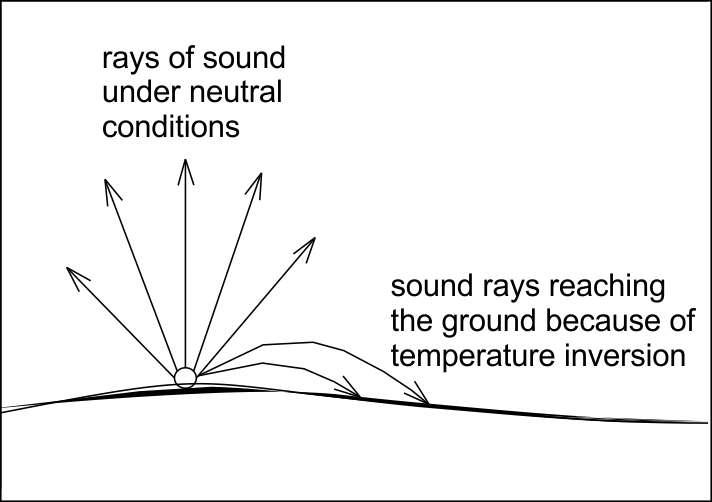
Since the speed of sound is higher with warmer temperatures, these changing temperature layers lead to sound moving in curved paths near the ground as shown in the picture. (2) Since the temperature structure can be complicated, so can be the sound propagation bending.
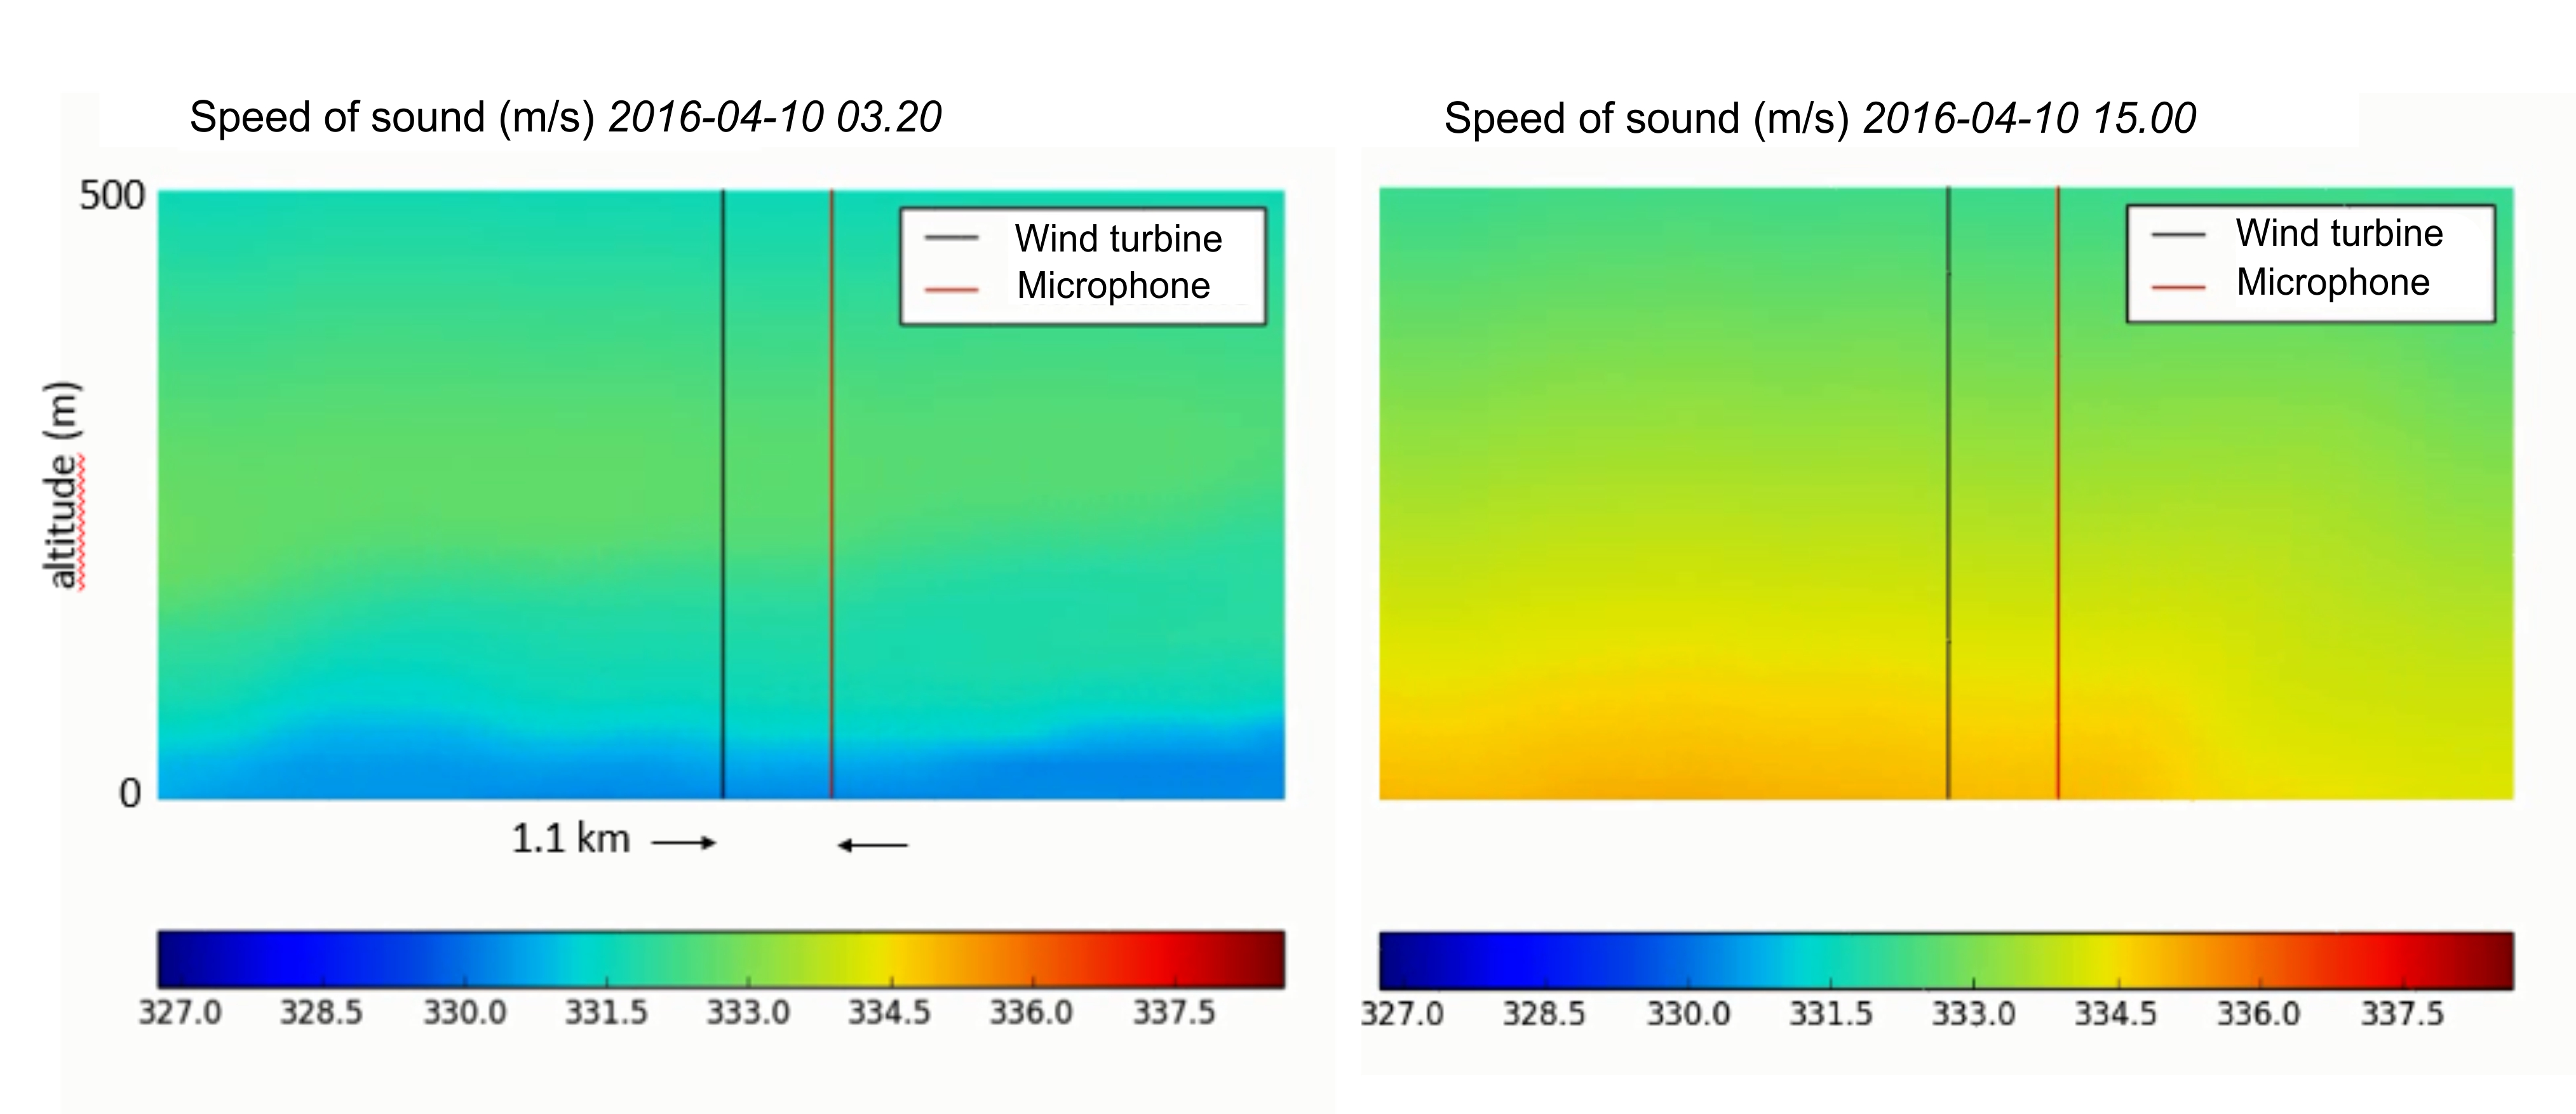
In dry air at 20 °C, the speed of sound is 343.2 m/s. The picture below shows an example of speed of sound in dry air at two different times the same day, from a WRF-model performed by members of the the Nordic Wind Energy Center, Drs Fonseca and MartinTorres of Luleå University. In the side by side plots of speed of sound, two very different scenarios are observed at different times on the same day. In one of the images the atmosphere is warmer near the ground and colder above. In the other image it is opposite. It is expected that when the sound goes through these two types of scenarios, on one of them, a distant observer would not hear the wind turbine noise and in the other, the distant observer would hear the wind turbine noise.
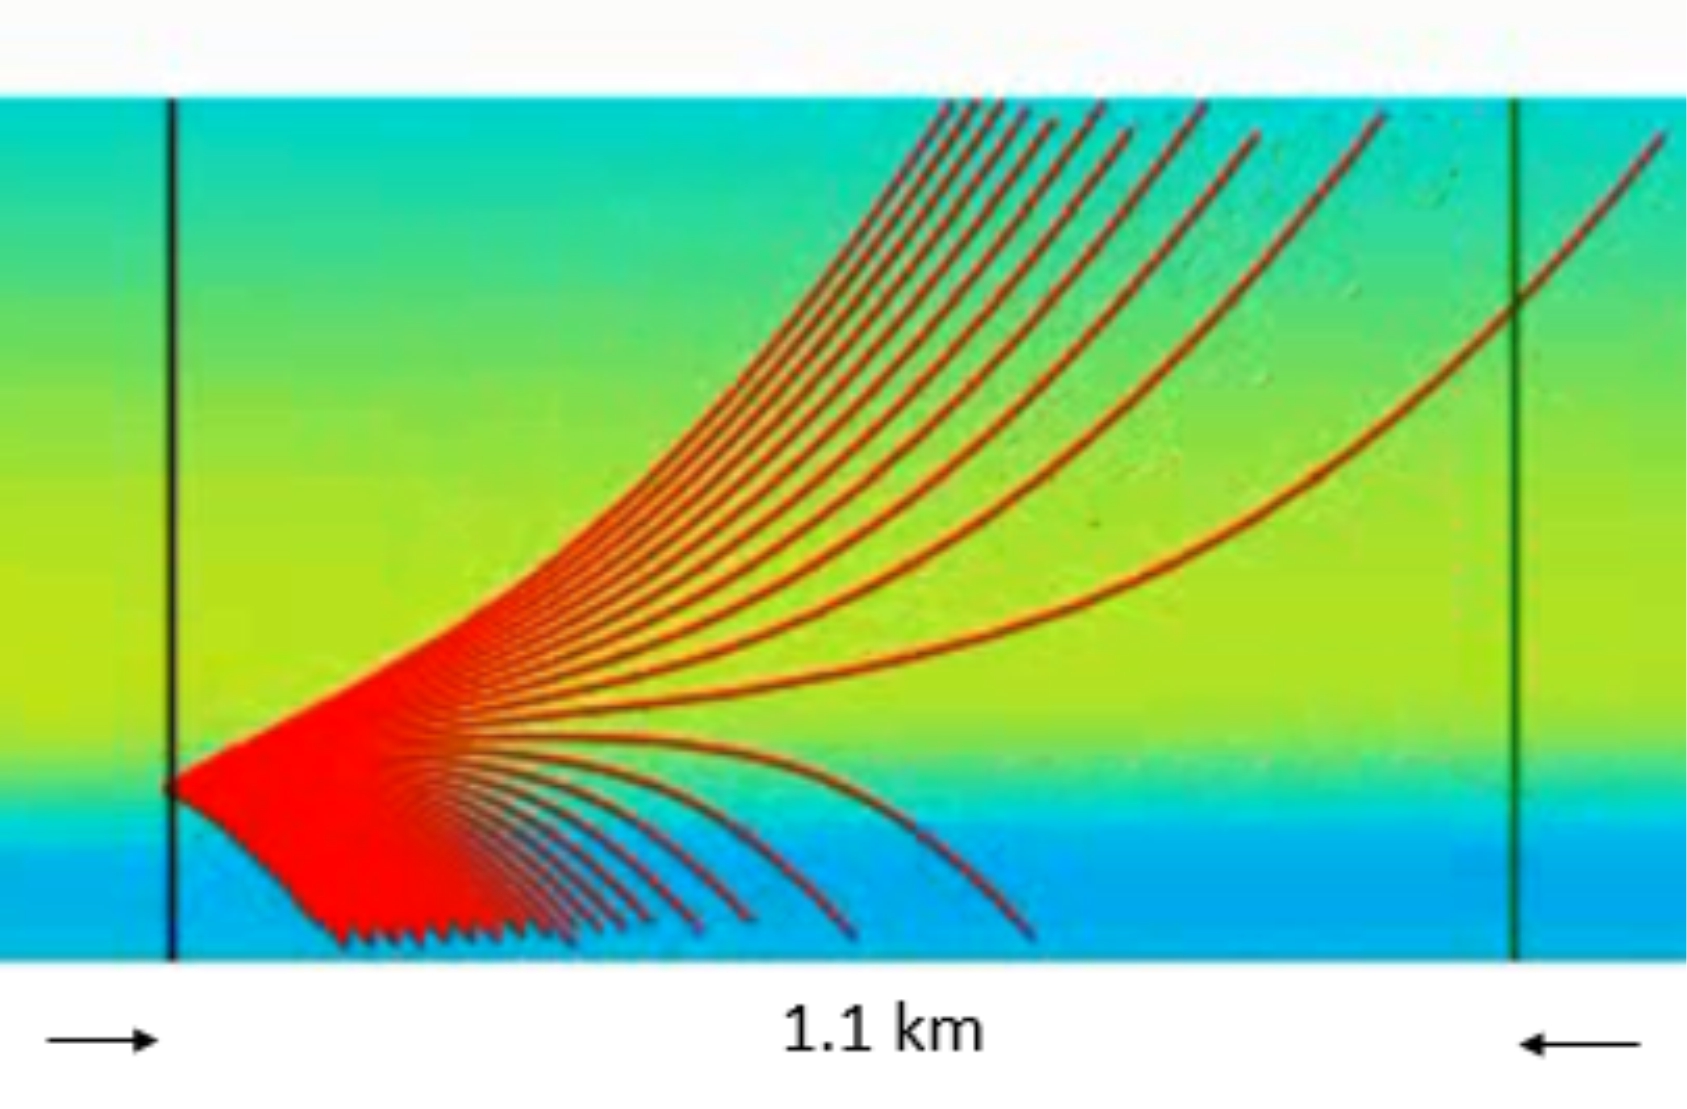
The way that the sound moves through the atmosphere can be estimated by acoustic ray tracing methods. As the temperature in the atmosphere varies, it affects the sounds propagation directions according to Snell’s law of refraction. The picture below shows an example of acoustic ray tracing from a hypothetical wind turbine, using one (10 minute) instance of the WRF results. It is to be remembered that the process described here is changing in time. In this way, you can see how the diurnal and seasonal weather effects actually modulate the sound propagation. In the ray tracing diagram, the rays “bend” according to the temperature and wind fields observed at the moment. So the plot represents a single 10 minute summary of how the sound travels through the atmosphere.
In the display, we have ignored relections and interactions for the ground. Also here, the frequency in undefined, so these are generic results. In the example, the rays are released at a height appropriate for large modern day wind turbines, approximately 75% of the altitude associated with the rotor plane top height is used. The rays initially are directed every few degrees but as they travel through the atmosphere, the environmental factors cause them to bend. In this exmple there is a strong gradient near the height of the wind turbine acoustic source location and some rays are bent downward and some are bent upward.
The rays can be thought of as paths of which the acoustic energy (sound) is transferred. In this case, a microphone or person listening at the location (on the ground) 1.1 km away from the wind turbine would not hear the wind turbine (as no rays come close to this point on the ground). At other times, the wind turbine acoustics can be observable. A goal of the project is to understand the proportions of time that the wind turbines can and can’t be detected (and use the weather data to explain why).
By understanding the atmospheric effects on sound propagation, the Nordic wind energy industry is developing a clearer understanding of their operational environment.
Sources
1. Pelkonen Antti, FMI. The boundary layer in Finland during winter. The European Forecaster Newsletter 5/2006. http://www.euroforecaster.org/newsletter11/full_2006.pdf
2. O’Connor Michael. Temperature Inversions & Sound Propagation. MO’C Physics Applied. Webpage. http://mocpa.com/inversion.html